


Australian home prices fell for a 13th consecutive month in October, driven by continued falls in Sydney and Melbourne, the largest and most expensive capital city markets.
CoreLogic’s Home Value Index slid 0.5% — the same decline reported in September — leaving the decline over the past 12 months at 3.5% in average weighted terms, the steepest drop since early 2012.
By type of property, house price nationally fell by 0.5%, extending the drop over the past year at 3.7%. Unit prices fell by a smaller 0.4% over the month, and by 2.7% over the year.
The average capital city price fell 0.6% from a month earlier, again, the same pace reported in September. Over the past 12 months, the average median price in the capitals slumped 4.6%.
Capital city unit values fell 0.5% from September, outpaced by a larger 0.6% decline in house prices. Over the year, prices fell by 3.2% and 5.1% respectively.
Home prices in regional areas also softened, falling 0.2%, trimming the gain over the past year to 0.8%.
However, while prices nationally continued to decline in average weighted terms, the weakness largely reflected decline in just three cities — Sydney, Melbourne and Perth where prices skidded 0.7%, 0.7% and 0.8% respectively from a month earlier.
In September, prices fell in five of Australia’s eight capital cities, suggesting that rather than becoming more widespread, losses may now be narrowing to just a few specific centres.
Over the year, price declines ranged from 7.4% in Sydney to 2.9% in Darwin. Median prices in Melbourne fell by 4.7%.
In Sydney and Melbourne, the declines over the past year has seen median home prices in these cities fall by around $70,000 and $45,000 respectively.
In percentage terms, the annual decline in Sydney was the largest since February 1990.
Despite prices falling in less locations than September, Tim Lawless, Head of Research at CoreaLogic, says that from a longer-term perspective, it’s clear prior declines in Sydney and Melbourne are now starting to influence price movements across the country.
Being the largest and most expensive housing markets in Australia, that disparity predominantly reflected price movements in Sydney and Melbourne.
Sydney and Melbourne contain around 40% of Australian homes, and around 60% of national housing wealth. That means price movements in these cities are influential on national averages.
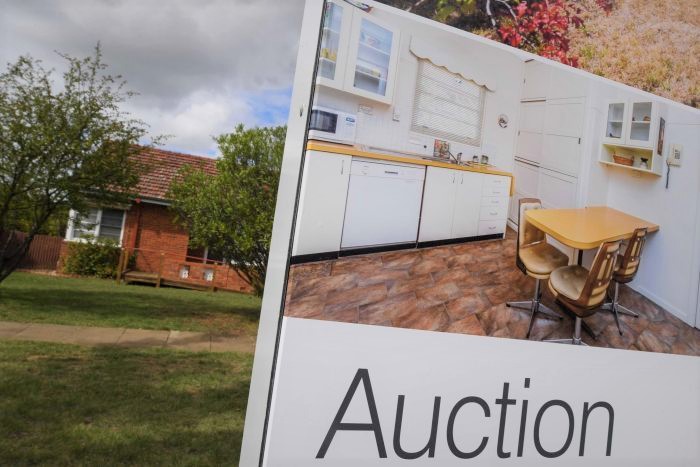
The impact of tighter restrictions on high debt and loan-to-income borrowers may also explain why auction clearance rates in Sydney and Melbourne continue to languish below 50%, the lowest level seen since earlier in the decade.


Australian home prices fell for a 13th consecutive month in October, driven by continued falls in Sydney and Melbourne, the largest and most expensive capital city markets.
CoreLogic’s Home Value Index slid 0.5% — the same decline reported in September — leaving the decline over the past 12 months at 3.5% in average weighted terms, the steepest drop since early 2012.
By type of property, house price nationally fell by 0.5%, extending the drop over the past year at 3.7%. Unit prices fell by a smaller 0.4% over the month, and by 2.7% over the year.
The average capital city price fell 0.6% from a month earlier, again, the same pace reported in September. Over the past 12 months, the average median price in the capitals slumped 4.6%.
Capital city unit values fell 0.5% from September, outpaced by a larger 0.6% decline in house prices. Over the year, prices fell by 3.2% and 5.1% respectively.
Home prices in regional areas also softened, falling 0.2%, trimming the gain over the past year to 0.8%.
However, while prices nationally continued to decline in average weighted terms, the weakness largely reflected decline in just three cities — Sydney, Melbourne and Perth where prices skidded 0.7%, 0.7% and 0.8% respectively from a month earlier.
In September, prices fell in five of Australia’s eight capital cities, suggesting that rather than becoming more widespread, losses may now be narrowing to just a few specific centres.
Over the year, price declines ranged from 7.4% in Sydney to 2.9% in Darwin. Median prices in Melbourne fell by 4.7%.
In Sydney and Melbourne, the declines over the past year has seen median home prices in these cities fall by around $70,000 and $45,000 respectively.
In percentage terms, the annual decline in Sydney was the largest since February 1990.
Despite prices falling in less locations than September, Tim Lawless, Head of Research at CoreaLogic, says that from a longer-term perspective, it’s clear prior declines in Sydney and Melbourne are now starting to influence price movements across the country.
Being the largest and most expensive housing markets in Australia, that disparity predominantly reflected price movements in Sydney and Melbourne.
Sydney and Melbourne contain around 40% of Australian homes, and around 60% of national housing wealth. That means price movements in these cities are influential on national averages.
The impact of tighter restrictions on high debt and loan-to-income borrowers may also explain why auction clearance rates in Sydney and Melbourne continue to languish below 50%, the lowest level seen since earlier in the decade.


